Welcome to our sneak peek into the Admin Power Hours Track for Delivery 2016: Reporting
Reporting is a critical part of managing your business, and project management is no exception. Project managers need to have access to robust reporting that shows the timeline, health, and potential risks of every project they’re overseeing, and that’s where Cloud Coach comes in. Let’s look at an example of how you can leverage Cloud Coach tools and reporting to keep your projects on track.
In this session you’ll learn how to:
Build reports that harness the power of Cloud Coach objects
Take your reporting to the next level with conditional highlighting
Build reports and dashboards that will “wow” your business users
The Problem
Universal Containers is having a hard time ensuring that their project’s expenses stay on course and don’t go over budget. By the time they notice a project is getting off track it’s often too late to keep the expenses from ballooning out of control.
The Solution
Our project manager is going use Cloud Coach Expenses to create a report that shows all project expenses, and highlight when actual expenses are getting close to exceeding budgeted expenses.
Step One: Create a New Report
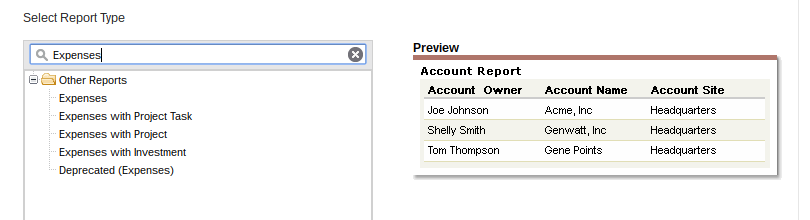
Let’s start by creating a new report from our Report Type: Expenses with Projects. We navigate to Reports, click on Create New Report, and select “Expenses with Projects.”
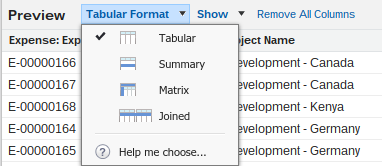
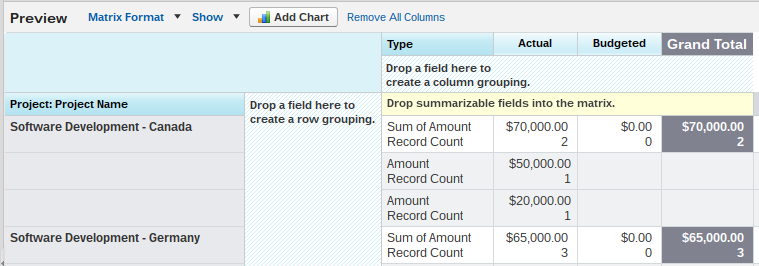
Once we’re within our report, we’ll want to set it up as a matrix report. There are a number of advantages to using the matrix format, but the main reason we’re using it today is so that we can group by row and column.
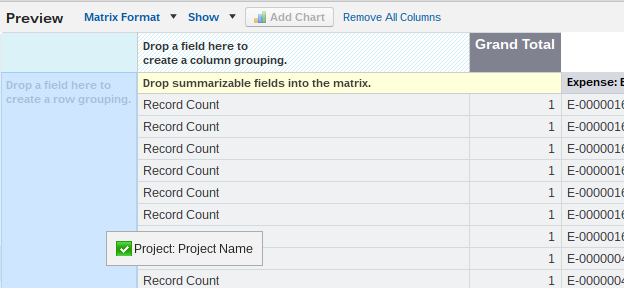
Now that we’re in our report let’s clean it up by removing Expense Name, and by moving the Project Name field into the area for row grouping.
After we’ve added Project Name to the row grouping, we choose Type from the Expense field options in our left window and move it into the area for column grouping. These column groupings allow us to see columns for actual and budgeted expenses.
Step Two: Create a Summarizable Field
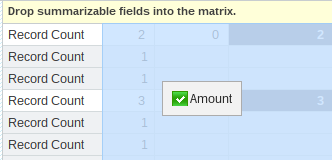
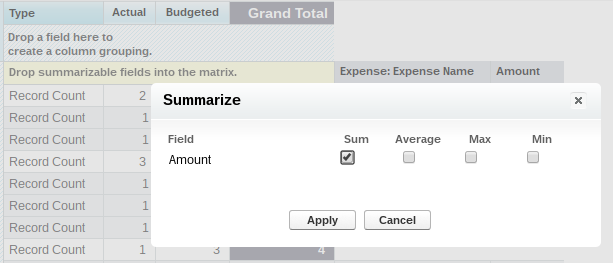
Just seeing the number of record types for our projects expenses doesn’t help us, because our project manager needs to see the sum of the actual and budgeted expenses. Select Amount from the Expense fields in the left window and drag it into the area for summarizable fields.
A new window opens that allows us to select which option we’d like for our Amount field. Choose “sum” since we want to know the total amount for actual and budgeted expenses.
Now we have a tidy little report listing the sum amount for actual and budgeted expenses.
Now, we could stop there if the only thing our project manager cared about was seeing a report of just actual and budgeted expenses. But the problem we’re trying to solve requires the ability to see how close the actual expenses are getting to the budgeted expenses. Let’s create a custom formula to show us the percentage of actual expenses to budgeted expenses
Step Three: Add a Formula Field
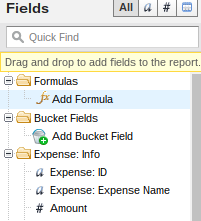
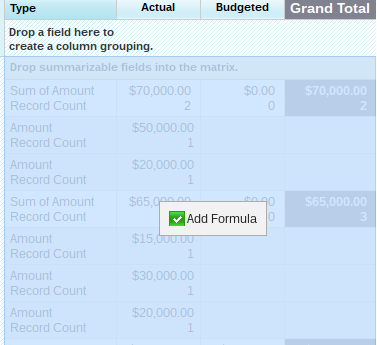
Begin by selecting “Add Formula” from our options in the left window.
Next, we drag and drop it into the summarizable field under column grouping.
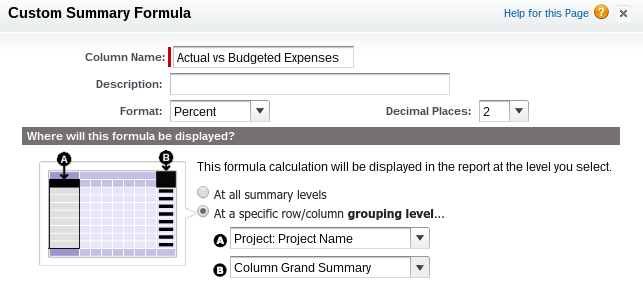
A new screen opens where we can customize our formula. Give it a name like, “Actual vs. Budgeted Expenses” and change Format to Percent. While we’re on this screen, we also want to select at which level to display our formula. Since we don’t want it on every column, choose “at a specific row/column grouping level…” That will allow us to select Project Name for option “A” and Column Grand Summary for option “B”.
When you’re finished it should look like this:
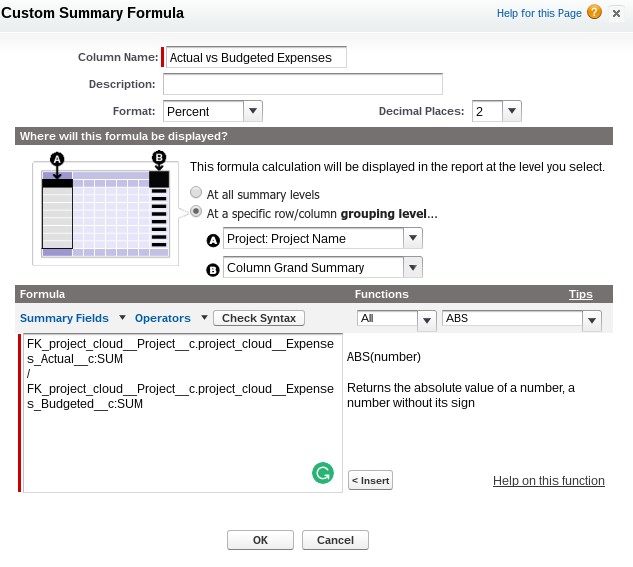
Next, we enter the actual formula. Since we want the percentage of actual expenses vs. budgeted expenses, we need to select those two fields in the Summary Fields drop down box—making sure to choose “sum”—and then divide the former by the latter.
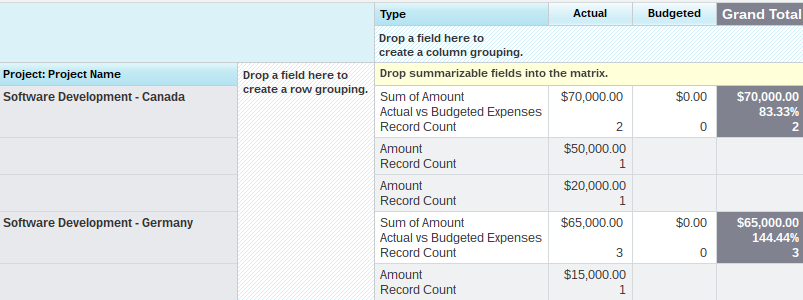
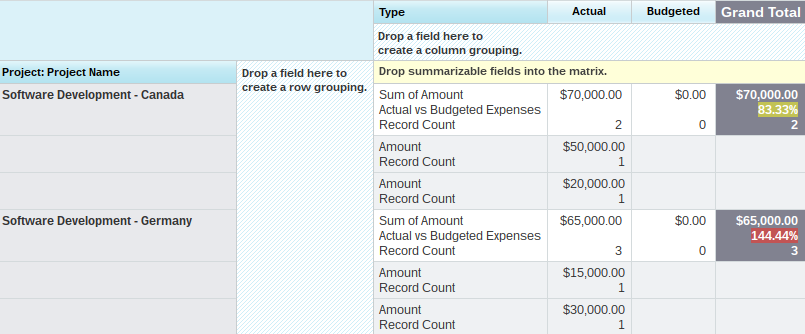
Now we have a row under Grand Total that shows our percentage of Actual vs. Budgeted expense per project.
Step Four: Add Conditional Highlighting
Our project manager now has a report that shows how close his actual expenses are getting to his budget. Let’s take the process one step further and add some conditional highlighting so he can easily see which projects are in danger.
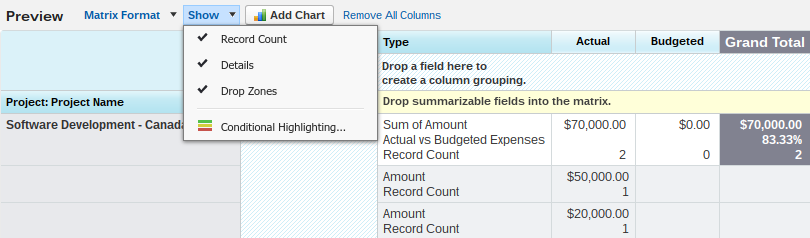
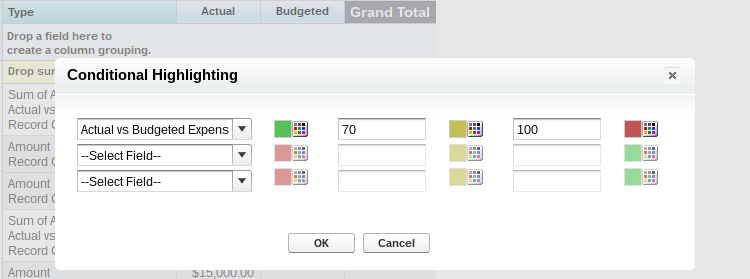
Start by selecting “Show” in the drop down box above the report and select “Conditional Highlighting.”
Next, choose which field we want to highlight—our new field, Actual vs. Budgeted Expenses—and select our colors: Green for anything under 70, Yellow for anything under 100, and Red for everything over.
Once those parameters are defined, our report shows our percentage fields with color coding to improve visibility for our project manager.
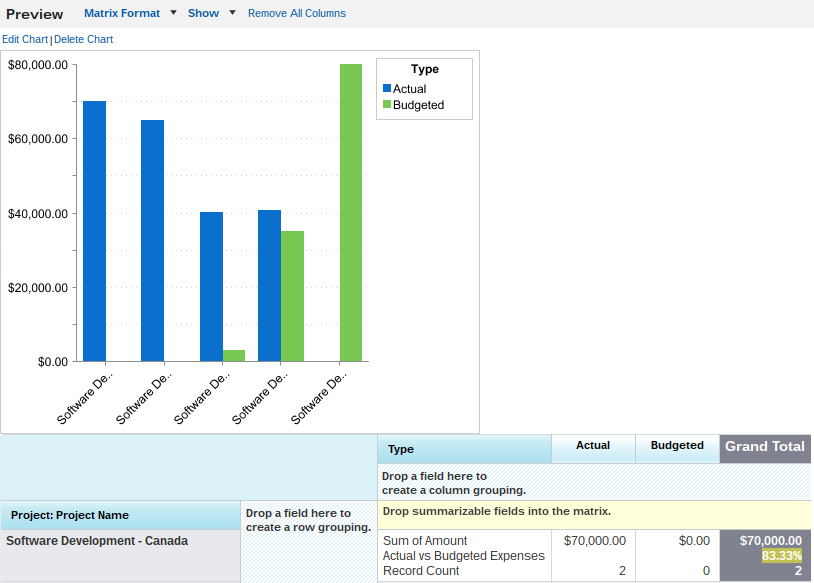
Step Five: Create a Chart
Our report is looking pretty great. The final step is to add a chart so our project manager can get an at-a-glance view of our expenses.
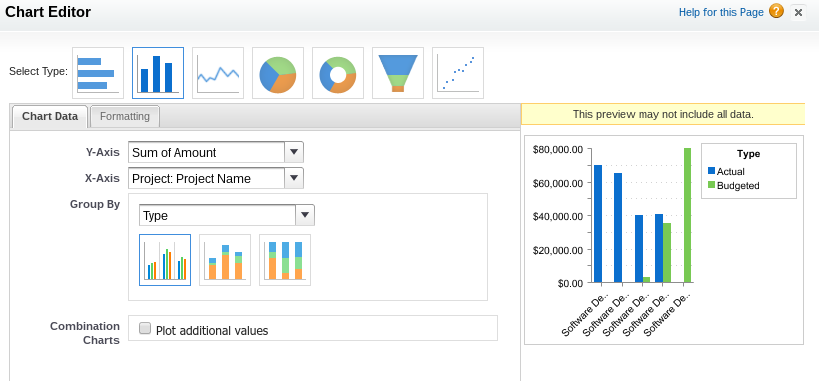
Select the “Add Chart” button at the top of the report. Once the chart screen is open, select a vertical bar chart, and configure it to show Sum of Amount in the Y-Axis, Project: Project Name in the X-Axis, and finally, Group by Type.
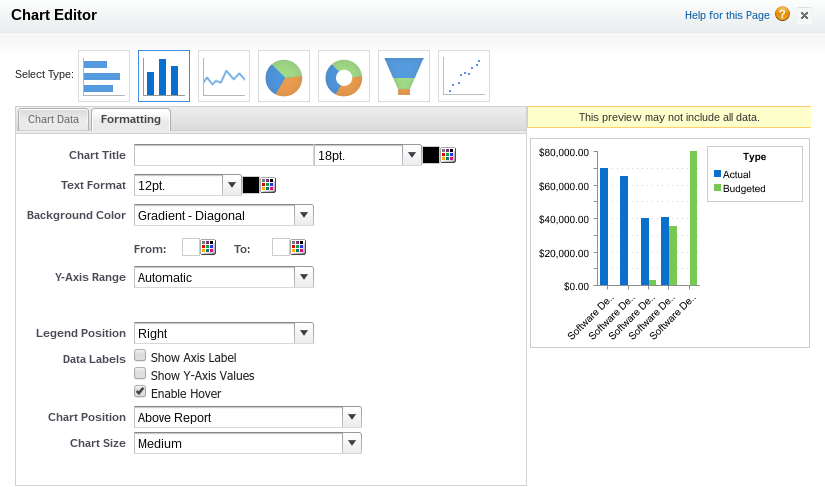
We can further customize the chart by clicking on the Formatting tab and selecting Enable Hover—so our project manager can easily tell the amount of each expense—and clean it up by unclicking the checkbox for “Show Axis Label.”
Click OK and look at the completed chart:
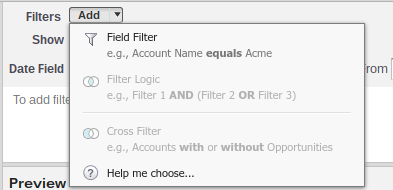
Step Six: Add Filter Criteria
Our report is almost ready to run. Before we do, we want to make sure it’s only showing the records that are pertinent to our problem. We only need to see actual projects with expenses, so let’s add a filter to remove any project templates from our report.
Begin by selecting a Field Filter from the “Add” drop-down box at the top of the reporting page.
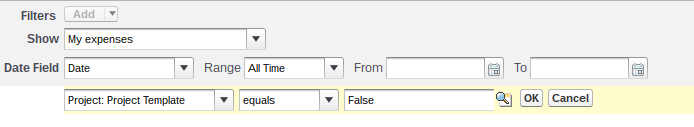
From there, select Project: Project Template for our field, and set the criteria to “equals False.”
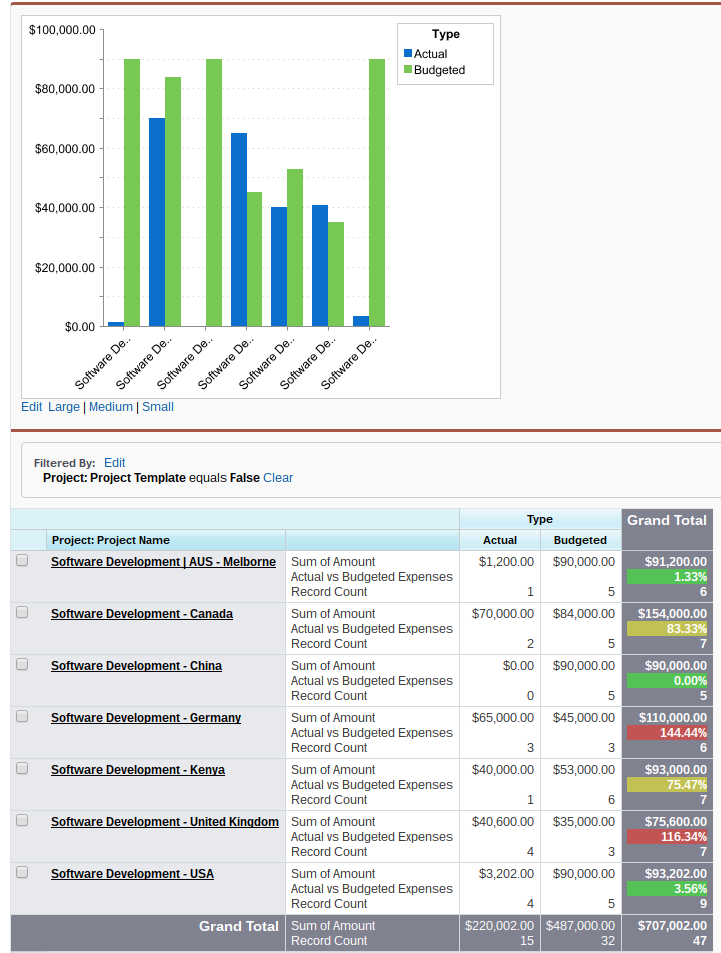
Click OK, and that’s it! Our report is ready to be run. Make sure to save your report, then click “Run Report” at the top of the page. We should see a nice layout of color-coded percentages with a chart at the top, showing our actual and budgeted expenses at a glance.
Step Seven: Create a Dashboard
Now that we have our finished report, the last step is to create a dashboard that shows our bar chart at a glance, so our project manager knows when his projects are in trouble.
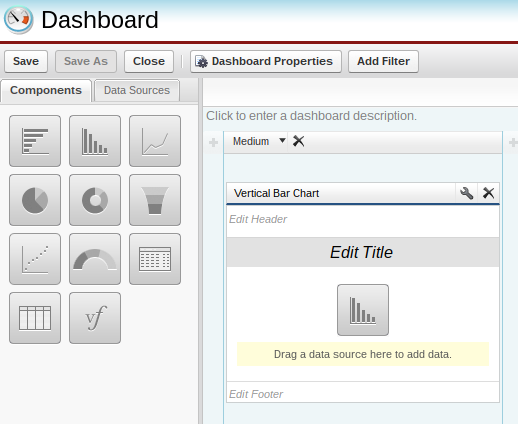
First, let’s go back to Reporting and select “New Dashboard.” That will take us to the Dashboard creation screen, where we can select a Vertical Bar Chart from the components in the left window, and drag and drop it into the workspace.
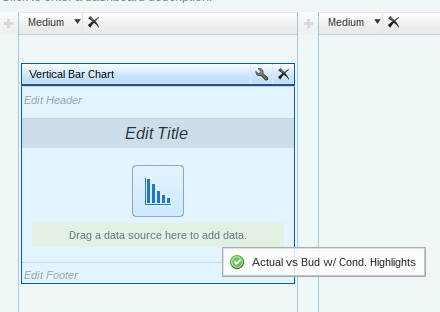
For the next step, we’ll want to add a Data Source to our Dashboard. Select our new report—Actual vs. Budgeted Expenses—from the “Data Sources” tab in the left window, and drop it into our bar chart.
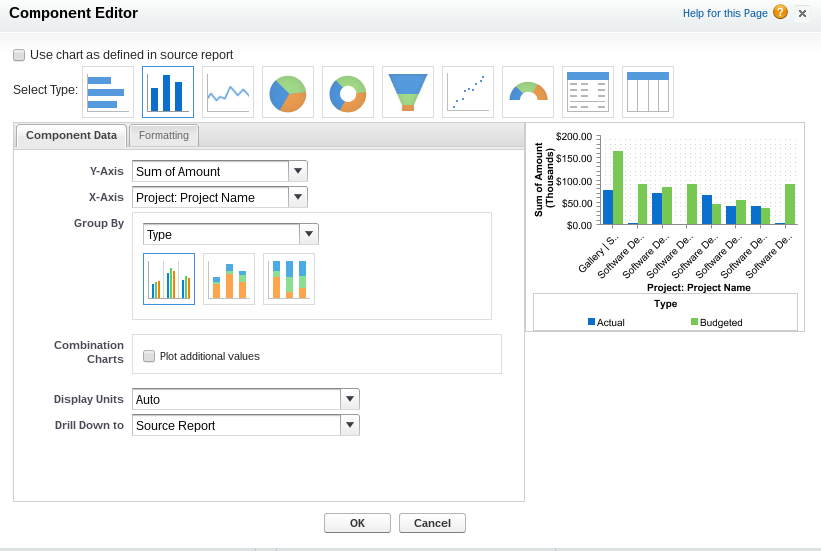
This opens the Component Editor, where we can customize the Y-Axis to show Sum of Amount, the X-Axis to show Project: Project Name, and finally, Group By Type.
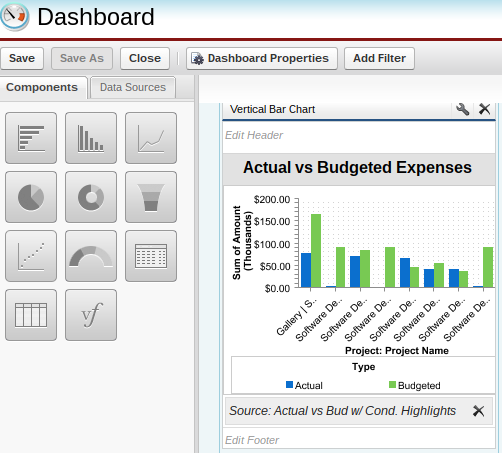
When we’re finished, we see a dashboard that mimics the look of our reporting chart, showing our projects actual vs. budgeted expenses.
Conclusion
Now our project manager has a report and a dashboard he can use to track budgeted versus actual expenses. By harnessing Cloud Coach expense tracking, he was able to create a report that is going to show him projects that are getting close to budget trouble so he can head them off before they cross the point of no return. And since he can share his new report and dashboard, any executives or stakeholders who want to know the status of a project can easily see how the actual expenses are stacking up against the project budget.
It’s just that easy!
AUTHOR
Nic Widhalm
Nic is the Global VP, Customer Experience, at Cloud Coach
In today’s rapidly evolving business landscape, organizations are constantly looking to find innovative ways to improve customer satisfaction and retention....
Navigating the intricacies of project management, whether it’s client-facing endeavors or internal IT initiatives, requires a delicate balance of communication...
Jacob Huisingh
Feb 28 20243 min read
Want to see Cloud Coach in action?
Cloud Coach is secure and customisable platform for successfully delivering customer projects of all shapes and sizes.
A Cloud Coach advisor will be in contact by email within one working day to arrange your demo.
We use necessary cookies to ensure our site functions properly. Additionally, we'd like to set analytics cookies to help us improve your experience by measuring site usage. For more details on the cookies we use, please visit our Privacy Policy page.
This website uses cookies to improve your experience while you navigate through the website. Out of these cookies, the cookies that are categorized as necessary are stored on your browser as they are essential for the working of basic functionalities of the website. We also use third-party cookies that help us analyze and understand how you use this website. These cookies will be stored in your browser only with your consent. You also have the option to opt-out of these cookies. But opting out of some of these cookies may have an effect on your browsing experience.