Using Formula Fields to Calculate Earned Value on Projects

Nic Widhalm

Sep 16 2016 14 min read

There are few fields of study that are more intimidating than Project Managment. And no aspect of Project Management is more tricky than that of Earned Value Analysis—or put another way, how much is my project worth at this moment, the moment we started, and the moment we finally finish. A good Project Manager could while away an entire afternoon with a calculator, a good project management book, and a whole lot of coffee just to nail down the metrics on a single project.

Luckily, Cloud Coach has you covered.

If you had a chance to sit in on our webinar last week, you’ve already had a look at how you can leverage the already-existing fields in Cloud Coach to manage Earned Value Analysis on your projects (and you can always watch the recording in case you missed it), but today we’re going to get into the guts of how exactly we made those formula fields. When you’re finished you’ll have a new set of metrics that looks similar to the image below:

So with no further ado, away we go.

Earned Value

Let’s start with—arguably—the most important field: Earned Value. Earned Value, in a nutshell, is how much of the budget and time has been spent at this point in the project. Assuming we have a budget for our project (we probably should), and assuming our project will return at minimum as much value as our budgeted costs (otherwise why did we start it in the first place?), then we can assume after two months that it has accrued at least as much value as our budget and the amount of time we have spent working on it.

So how do we calculate it?

Using Cloud Coach fields that already exist in our managed package, we’re going to create a formula field that calculates Total Budgeted Costs * Completion %.

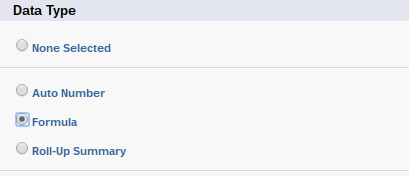
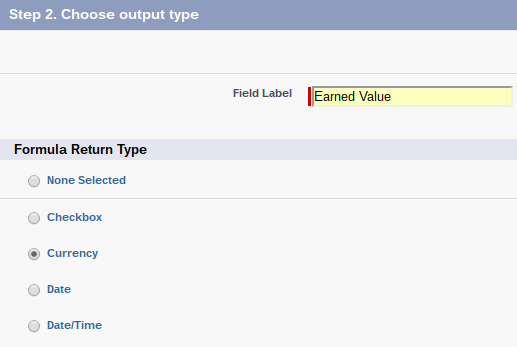
We’ll start by going to Setup, choose Create, pick Objects, and navigate to Projects. Then we’re going to create a new custom field and select Formula Field (Currency):

And once we’re in the formula editor, the syntax is pretty simple:

Planned Value

Alright, let’s move on to the second part of Earned Value Analysis—Planned Value. While Earned Value tells us what our project’s value actually is , Planned Value tells us what we thought it would be by this point. Planned Value takes our initial estimates—translated into Cloud Coach fields: Estimated Hours and Total Budgeted Costs—and looks at them over the timeline of the project. At two months into the project duration, how far along and how much of our budget should we have spent by this point?

What’s the formula? Simple enough: Total Budgeted Costs * (Entered Hours / Estimated Hours) . Or, in Cloud Coach fields:

Cost Variance

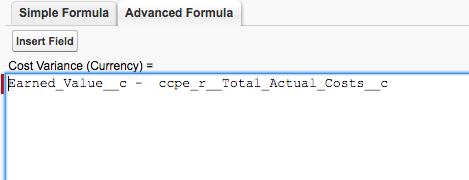
We know where we planned to be, and we know where we currently are, so the next step is to calculate how well we’re managing our costs at this point. Cost Variance is a way to compare how much we budgeted for work performed (Earned Value) vs how much we’ve actually spent for work performed (Total Actual Costs). How much has our labor cost, and what are our expenses? That’s how we determine Total Actual Costs. Fortunately for us, Cloud Coach is already doing the heavy lifting and calculating Total Actual Costs for us.

The formula? Earned Value – Total Actual Costs

Cost Performance Index

Once we determine the variance between what we planned on spending, and what we’ve actually spent, the fun part starts. We can look at cost variance and get a sense of how well we’re managing cost—at least compared to what we budgeted—but what we really want to see is how efficient we are at costing. That’s where Cost Performance Index shines. CPI will give us a number that not only tells us how efficient we are at managing costs, but also allows us to report and compare simultaneous projects as well as project managers. Who manages costs well, and who needs more coaching?

The formula we’re going to use is Earned Value / Total Actual Costs, and the number we’re hoping to get is 1+. 1 or greater and our project costs are looking good—less than 1, well, I guess we have some work to do getting that project back on track. And since we’re looking at a number instead of dollars, we’re going to use a Number formula field rather than Currency.

Schedule Variance

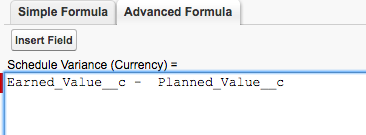
With cost covered, it’s time to move on to schedule. How is our timeline affecting our project value? If we’re ahead of schedule, how much money are we saving, and if we’re behind, how much is that costing us? The good news is that we’ve already done most of the work on calculating Schedule Variance, because we have a formula for Earned Value (where we are) and Planned Value (where we planned to be). So if our Planned Value is $35,000 at this point in the project, but we’re ahead of schedule and our Earned Value is $40,000, then our Schedule Variance is sitting pretty at $5000.

The formula looks like this: Earned Value – Planned Value

Schedule Performance Index

You can see the trend here. Just like cost, we want an index to show our timeline efficiency, so we can see how well we’re managing our time on this project, as well as running reports to compare other projects and project managers. Specifically, how well is this project doing compared to our initial planned schedule and budget?

We’re going to use Earned Value / Planned Value for this formula, with one important exception—since we’re just looking at schedule right now, we don’t want to calculate Total Budgeted Cost into our Earned Value and Planned Value calculations. We’re only looking at budgeted labor and worked performed, so instead of Total Budgeted Costs we’re going to plug in Budgeted Labor Costs.

Once again we’re hoping as good project managers to see this project come in at 1+. Anything under 1 means we have some work to get this project back on schedule.

Estimate At Completion

Not only can we use those performance indexes for reporting on the efficiency of our project delivery team, but we can combine them with Total Budgeted Costs to get an estimate of what we’re going to spend by the end of the project. Is our project estimated to come in under budget based on the work performed, or are we over budget and need to reevaluate our expenses to get back on track?

This formula uses the Cost Performance Index to calculate our estimate, giving us Total Budgeted Costs / Cost Performance Index

Estimate to Complete

Going hand-in-hand with Estimate at Completion (EAC) is Estimate to Complete (EC). Using EAC, we can see our final costs once we’re finished with our project—assuming we stay on the same trajectory—but with EC we can calculate how much more we need to spend on top of our actual costs to date. Of course, as rock star PM’s we’re hoping that EC is a small number or—if we’re lucky—negative.

The formula we’ll use is Estimate at Completion – Total Actual Costs

Variance at Completion

We have plenty of fields so far to tell us how our project is doing compared to our initial budgeted plans, the work performed so far, and our estimate of how much it will cost to deliver the project on time. But what about our budget at the end of the project? Will there be anything left?

For that calculation, we look to Variance at Completion, which is a formula telling us the difference between our Total Budgeted Costs (what we planned on spending) and our Estimate at Completion (what we need to spend to finish the project). Simple enough: Total Budgeted Costs – Estimate at Completion

To Complete Performance Index 

Our final formula field is a summation of everything we’ve built so far, and really gives us a sense of how overall our project is doing. Are our costs in-line? How about our schedule? Are we where we expected to be at this point, or do we need to catch up?

What To Complete Performance Index gives us is a single number that measures the difficulty in delivering our project’s Estimate at Completion (EAC) in-line with our planned Total Budgeted Costs. Unlike our other performance indexes, we want this number to be under 1. In other words, higher the number, the more difficult it is to get back on track and deliver our project on time and at (or under) budget.

This formula is more complex and looks like the following: (Budgeted Costs and Expenses – Earned Value) / (Budgeted Costs and Expenses – Total Actual Costs) 

Conclusion

With Earned Value Analysis you can get a clear picture of where your project is at every point in the delivery cycle. You can measure your efficiency at managing cost and timeline, see which of your project managers are exceeding expectations, and compare how projects stack up using performance indexes. Best of all, you can build every one of the formulas you need for Earned Value Analysis using fields that come out-of-the-box with your Cloud Coach License.

It’s just that easy.

AUTHOR

Nic Widhalm

Nic is the Global VP, Customer Experience, at Cloud Coach

Related Articles

Feature of the Month: Scenario Planning

Scenario planning is a strategic management tool, which is essential for professional services teams and  organizations looking to anticipate and...

Christian Langley

Mar 28 2024 3 min read

Feature of the Month: External Collaboration

Navigating the intricacies of project management, whether it’s client-facing endeavors or internal IT initiatives, requires a delicate balance of communication...

Jacob Huisingh

Feb 28 2024 3 min read

Want to see Cloud Coach in action?

Cloud Coach is secure and customisable platform for successfully delivering customer projects of all shapes and sizes.

See Cloud Coach In Action

Cloud Coach is secure and customisable platform for successfully delivering projects of all shapes and sizes.

Schedule a tailored demo with one of our project specialists.

  • Fill out the form below
  • Our team will reach out within 24 hours to discuss your unique requirements
  • We’ll schedule a 1:1 demo with one of our product specialists  
medal 2 1
reCAPTCHA logo@2x

protected by reCAPTCHA

medal 2 1

Thank you

A Cloud Coach advisor will be in contact by email within one working day to arrange your demo.