Creating Salesforce Reports Using Your Cloud Coach Objects

Brandi Johnson

Jul 22 2015 8 min read

One of the most important reasons to track your projects in Salesforce is the ability to report on the measurable data that your projects generate. Whether you want to produce reports on the volume of tickets created by customer, the number of hours billed against a project, or the revenue generated by a certain kind of task, building Salesforce reports can help you leverage your Cloud Coach objects to improve your business processes. Here’s how to create reports in Salesforce using your Cloud Coach Projects, Tasks and Tickets.

What is a report?

A report is a list of records that meet the criteria you define. It’s displayed in rows and columns, and can be filtered, grouped, or displayed in a graphical chart. When creating reports you control what information you see, and based on the criteria you enter, what records will be displayed and how the user will see that information.  You can also add graphical representations of the data to your report.

How are reports organized?

All reports are stored in folders, the level of access to the folder determines who can view, edit, run, and delete the report contained in that folder.  Access can be public, hidden, or shared.

Salesforce Report Setup

Before you begin building your report, you should determine what you want to measure.  Each report can have a primary object, and one or more related objects.

You must first determine what should be the primary object in your report. You can then decide if you need secondary objects in your report. Once you have your primary and secondary objects selected you can choose whether to display primary records if they do not have a secondary object.

For example, you could have a report for Projects, or a report showing Projects with Tickets. In this case, project is the primary object and the tickets are the related objects. You can choose whether to show all projects, or just projects that have tickets.

Display primary if no secondary
Primary Secondary
Project 1 Ticket A
Project 2
Project 3 Ticket D
Project 4
Project 5 Ticket T
Do not display primary if no secondary
Primary Secondary
Project 1 Ticket A
Project 3 Ticket D
Project 5 Ticket T

Salesforce Report Types

There are four different report formats you can choose from.

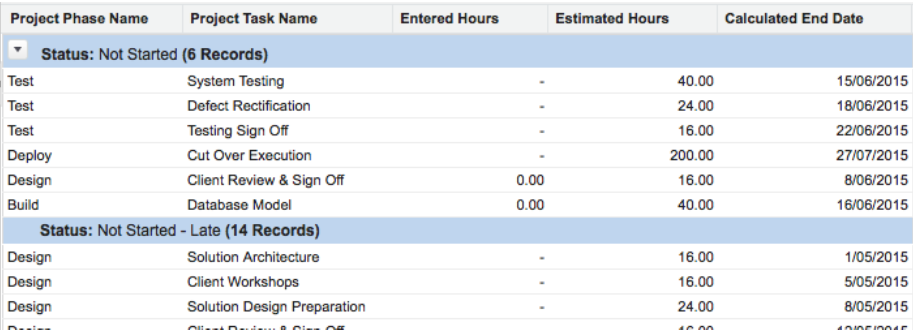
Tabular

A tabular report is a simple and quick way to view data.  Tabular reports are similar to a spreadsheet and contain information listed in rows with the fields you selected to display.  Tabular reports cannot have charts.

Creating Reports 1

Summary

A summary report is much like a tabular report, however it allows users to group rows of data, view subtotals, and create charts.

Creating Reports 2

Matrix

A matrix reports allow you to group and summarize data by both rows and columns. you can choose to display the underlying data, or just show the data table. It is a great way to compare totals, particularly if you have a large amount of data.

Matrix reports display as row and column headers, then totals within the body of the table. A matrix report is similar to a PivotTable in Excel.

Creating Reports 3

Joined

Joined reports let you create multiple blocks of report data in one report. Each block is a separate sub-report with its own fields, columns, sorting, and filtering.

Creating Reports Joined

Creating a Report

As a Salesforce app, Cloud Coach objects, such as Projects, Tasks and Tickets, have the same reporting capabilities and functions as standard Salesforce objects.

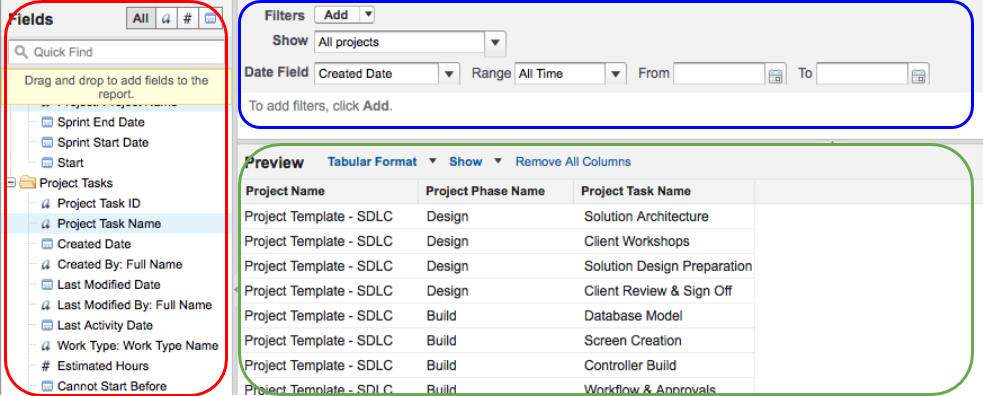
Creating a report is easy when you use the Salesforce Drag-and-Drop Report Builder. On the left of the page is the field list, and at the top of the page is the list of filters. In the center of the page you can see a preview of the report you are creating.

Creating Reports 4

Building a Sample Report

In our example today we will create a simple tabular report to show the status for all of our projects.

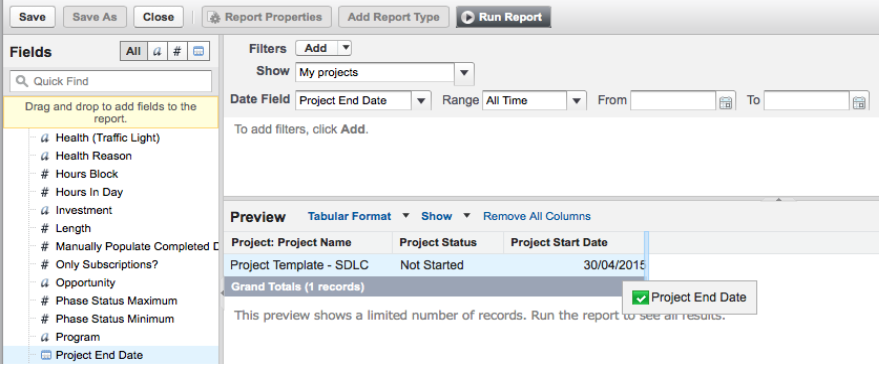
To begin, drag the fields from the field list to the preview pane. In this example, we’ve selected:

  • Project Name
  • Project Status
  • Project Start Date
  • Project End Date

Once you have selected your fields, you can then reorder the columns by simply dragging them to their new location.

Creating Reports Sample

Our Cloud Coach projects are now listed in our tabular report with all of the data we want to see. If you need to show only certain projects you can use the field filters, filter logic, and cross filters shown at the top of the page.

Creating Reports 6

When you are happy with the appearance of your report you can click on Run Report, this will pull all information from Salesforce into your report.  From there you can export your report details, print, and schedule a future run of your report.

Whether you are looking for project management, or professional services automation tools on the Salesforce platform, Cloud Coach has the tools for you. Request a demo today and learn how you can more quickly and efficiently manage your business, leveraging the Salesforce platform.

AUTHOR

Brandi Johnson

Related Articles

Want to see Cloud Coach in action?

Cloud Coach is secure and customisable platform for successfully delivering customer projects of all shapes and sizes.

See Cloud Coach In Action

Cloud Coach is secure and customisable platform for successfully delivering projects of all shapes and sizes.

Schedule a tailored demo with one of our project specialists.

  • Fill out the form below
  • Our team will reach out within 24 hours to discuss your unique requirements
  • We’ll schedule a 1:1 demo with one of our product specialists  
medal 2 1
reCAPTCHA logo@2x

protected by reCAPTCHA

medal 2 1

Thank you

A Cloud Coach advisor will be in contact by email within one working day to arrange your demo.