CHAPTER 1
1. Health by Project
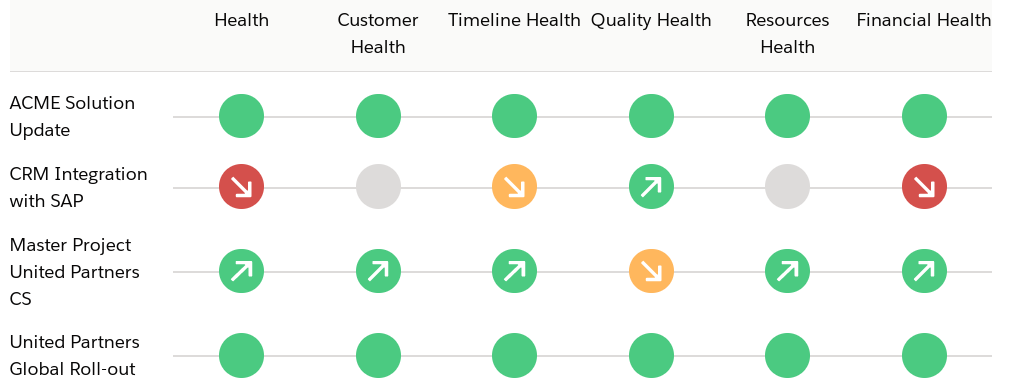
What it shows
At a glance the health of your projects.
Multiple health metrics, such as customer and timeline health across your customer onboarding projects including trend information of how your health has recently changed for each area.
Why it matters
As the manager of a team onboarding multiple customers, simultaneously being able to see the health of each project at a glance allows you to pre-emptively direct your team’s resources to solve issues before they derail your customer’s onboarding experience in a negative way.
CHAPTER 2
2. Time to Value

What it shows
The amount of time it takes for your customer to recognize value from your solution.
For some, this may be at project close, at a milestone within the project, or even after the initial onboarding engagement. Either way, with Cloud Coach you can track it in real-time.
Why it matters
CHAPTER 3
3. Hours Burned by Completion %
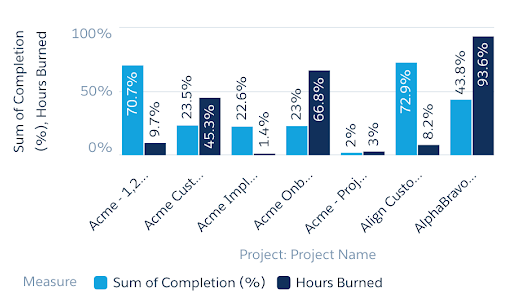
What it shows
How far along a Project is in completion terms, compared to how many hours have been burned / used against original estimates.
Why it matters
This report gives a great overview of how each Project is tracking towards completion in contrast to how much of the pool of estimated hours have been used to date. It provides critical early warning signs for managers alerting them when the estimated hours for a project are about to be exceeded.
CHAPTER 4
4. Project Burndown Metrics
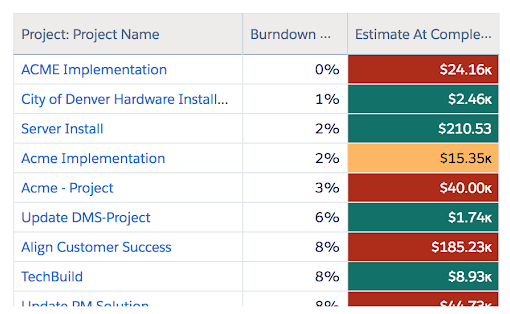
What it shows
How multiple Projects are tracking from a burndown perspective along with the forecasted Project profitability at completion based on current progress against burndown.
Why it matters
This report is a more advanced take on burndown metrics, adding in a financial forecast component to the effort remaining and tying it back into Project profitability. This gives executives a key insight into how a Project’s performance will impact the bottom line.
CHAPTER 5
5. Change Requests by Project
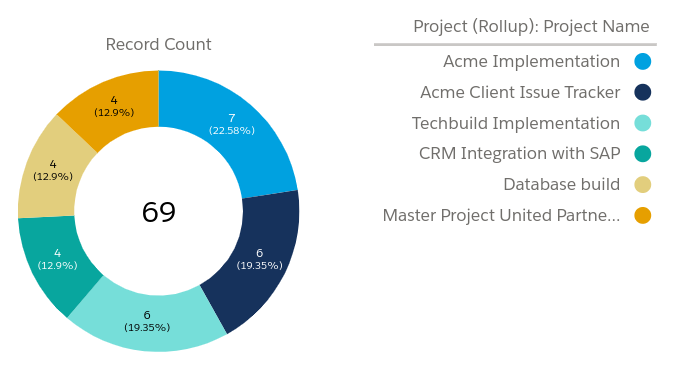
What it shows
Projects that currently have open change requests against them. These could be client change requests where additional requirements have been requested.
Why it matters
Change requests are part and parcel of customer onboarding but, if not managed properly, can cause delays to your project and damage your relationship with the customer.
Being able to see which projects have change requests against them allows you to proactively manage your onboarding projects to a successful outcome.
CHAPTER 6
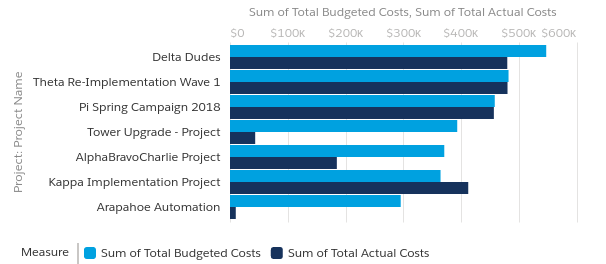
6. Budgeted vs Actual Costs
What it shows
Budgeted vs actual costs across a portfolio of Projects.
Why it matters
Tracking your actual spend against your budgeted spend for Projects is a key component towards overall Project profitability. With Cloud Coach, you can track both labor and non-labor costs against your Projects.
CHAPTER 7
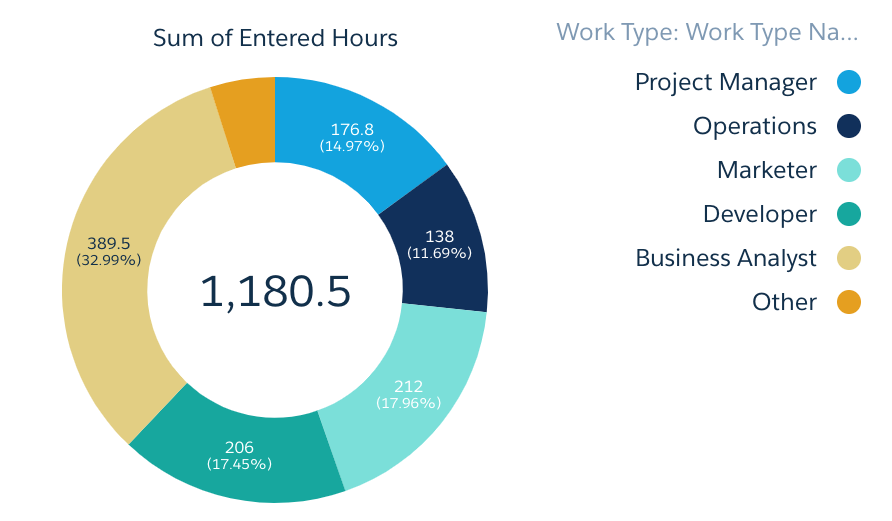
7. Estimated vs Entered Hours
What it shows
How much time has been entered on tasks compared to the original estimates, split out by skill / work type of your team.
Why it matters
Time tracked is a key metric for determining your project profitability. If your team is taking longer than estimated to complete work, your bottom line will suffer, and your projects run the risk of being delivered late, disappointing your customers.
CHAPTER 8
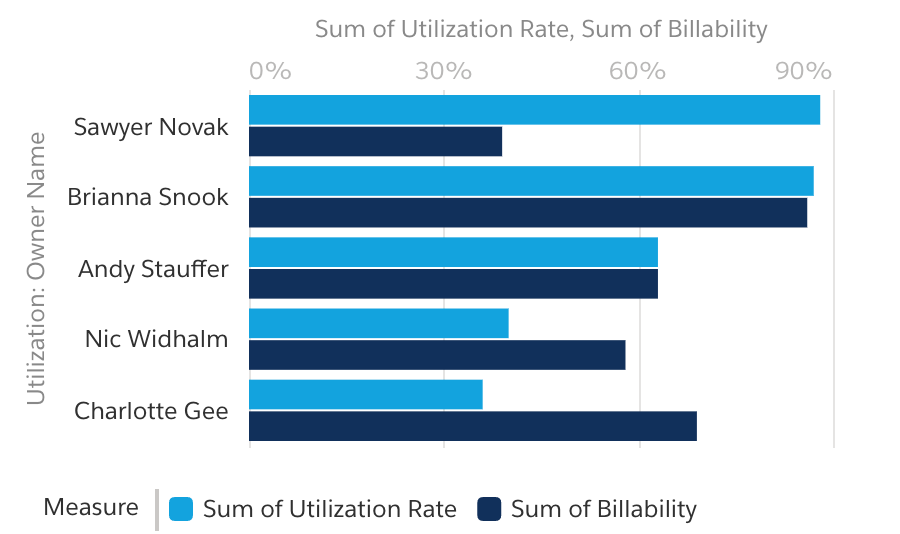
8. Utilization and Billability
What it shows
Report building on an employee’s utilization, adding in billability metrics.
Why it matters
A resource might be meeting your utilization metrics while working on items that aren’t directly billable, such as supporting sales. This report lets you measure not just the utilization of the team but also their billability, so you can make sure that the whole of your services team are contributing to your bottom line.
Thank you for reading our Report eBook. If there are any reports we haven’t featured that you’d like us to include, contact us at [email protected].


