
CHAPTER 1
1. Stage Gate Processes
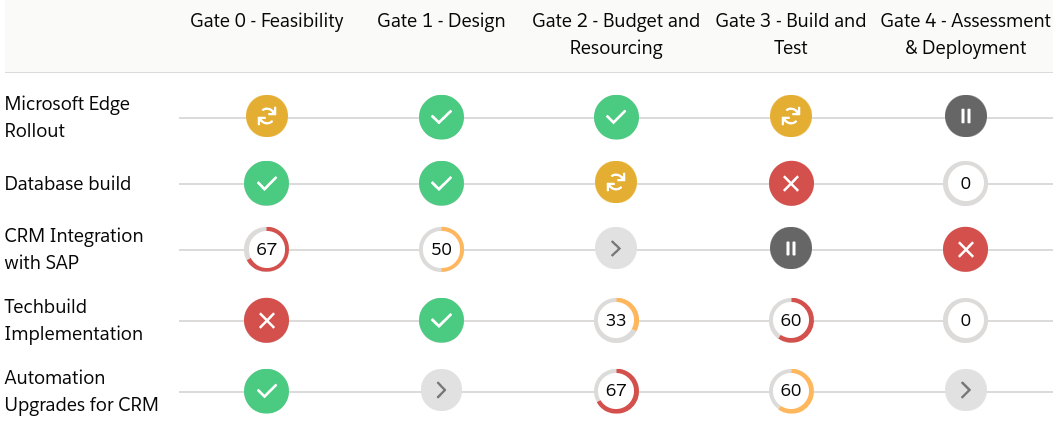
What it shows
Progress of planned projects through the gate process of the organization including progress towards each gate. The report also shows gate status, such as approved, rejected, on hold, skip or re-work.
Why it matters
Stage/Phase Gate processes keep your organization on track by putting your prospective projects through a standardized evaluation process before the bulk of the budget is committed.
Here you can see at a glance where all projects sit in the process with the ability to drill down into the underlying data.
CHAPTER 2
2. Planned Projects - Costs vs Benefits
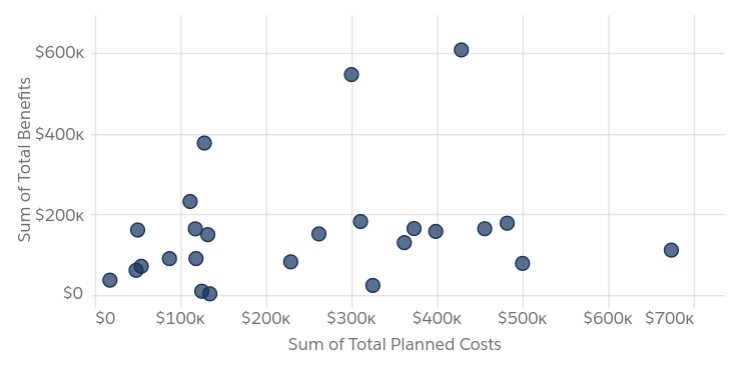
What it shows
A visual representation of planned costs versus projected benefits of the currently planned projects that sit in the demand pipeline.
Why it matters
When deciding on which projects to move forward with from your demand pipeline, having an easy way to visualize where your organization can get the most ROI is key.
With the ability to drill down into individual records and take action, this report can help your organization’s spend go to the right places.
CHAPTER 3
3. RAID by Project
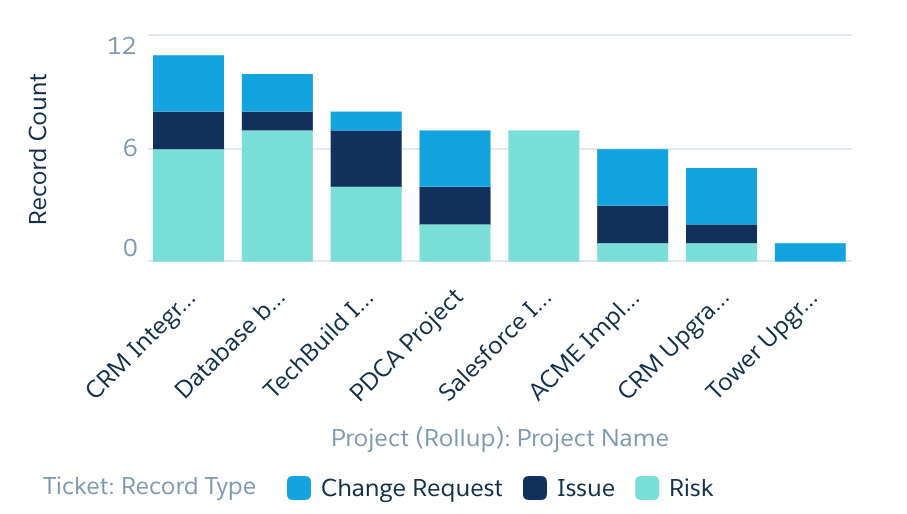
What it shows
Project ‘Controls’ including Risks, Issues and Change Requests grouped by Project.
Why it matters
Great Project delivery involves managing the intangibles that come up along the way, such as identifying and mitigating Risks, managing Issues that arise and capturing Change Requests along with associated cost and profitability impacts. This report gives insight into the ‘Controls’ that need managing across your portfolio.
CHAPTER 4
4. Unassigned Project Tasks
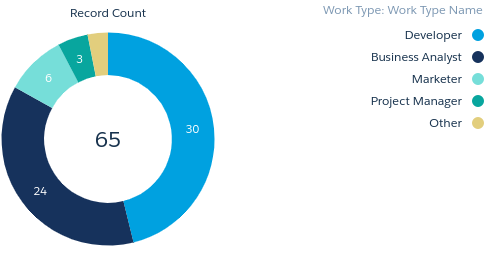
What it shows
Report showing unassigned tasks split out by the work type / skill needed to perform each task.
Why it matters
If you have unassigned work, you risk task and Project delivery dates slipping. Ensuring your Projects are fully resourced with the right people with the right skill sets means more on-time delivery for your business and happier customers.
CHAPTER 5
5. Hours Burned by Completion %
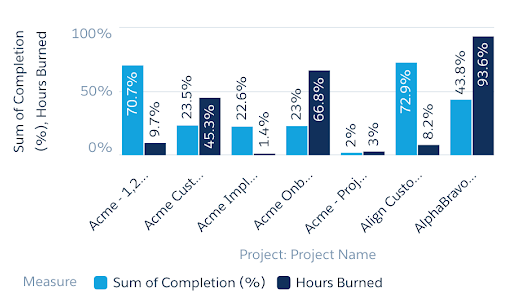
What it shows
How far along a Project is in completion terms, compared to how many hours have been burned / used against original estimates.
Why it matters
This report gives a great overview of how each Project is tracking towards completion in contrast to how much of the pool of estimated hours have been used to date. It provides critical early warning signs for managers alerting them when the estimated hours for a project are about to be exceeded.
CHAPTER 6
6. Budgeted vs Actual Costs
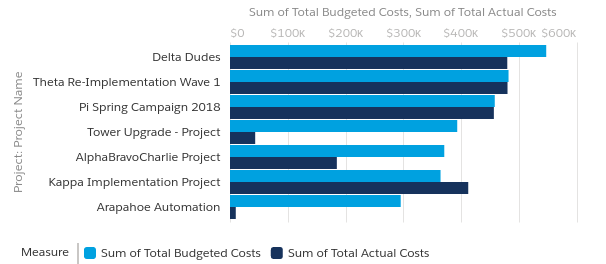
What it shows
Budgeted vs actual costs across a portfolio of Projects.
Why it matters
Tracking your actual spend against your budgeted spend for Projects is a key component towards overall Project profitability. With Cloud Coach, you can track both labor and non-labor costs against your Projects.
CHAPTER 7
7. Margin by Portfolio
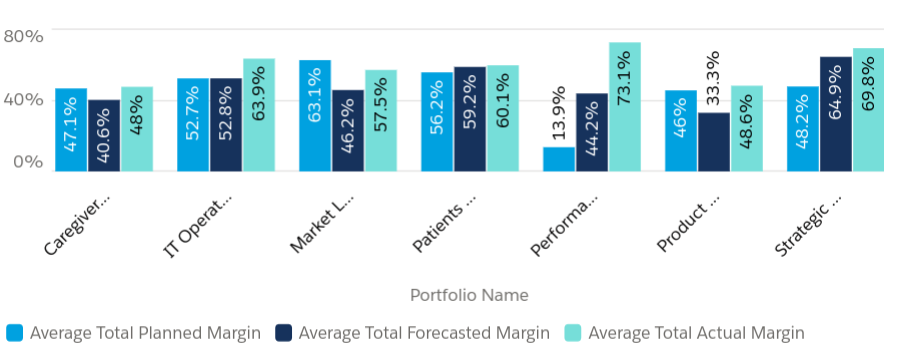
What it shows
Planned, forecasted and actual margin for all the currently active portfolios within the organization.
Why it matters
Portfolios are key to ensuring the strategy for your organization is being delivered in a cost-effective manner.
Being able to see the originally planned margin against the forecast and actual margin, gives key insights into which portfolios area delivers the most ROI and which might need adjusting.
CHAPTER 8
8. Program Spend vs Budget
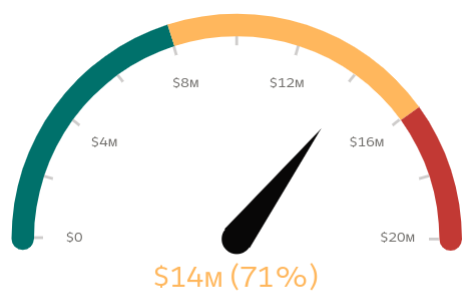
What it shows
Actual spend across the projects contained within a program compared to budget, displayed as a percentage of total budget.
Why it matters
Keeping spend on track when your executing your projects is key to get the outcomes your business is looking for.
This report gives managers a quick view at the program level into where spend sits against overall progress of the underlying projects.
Thank you for reading our Report eBook. If there are any reports we haven’t featured that you’d like us to include, contact us at [email protected].